Uploaded image for project: 'DRP 2-D Pipeline'
  1. DRP 2-D Pipeline
  2. PIPE2D-837

Regrid stellar parameters for combined P_HSC and P_PFS

    Details

      Description

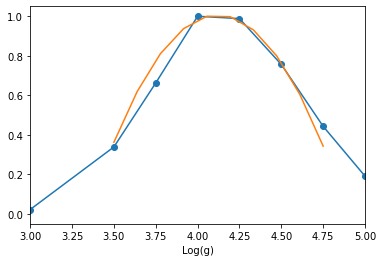
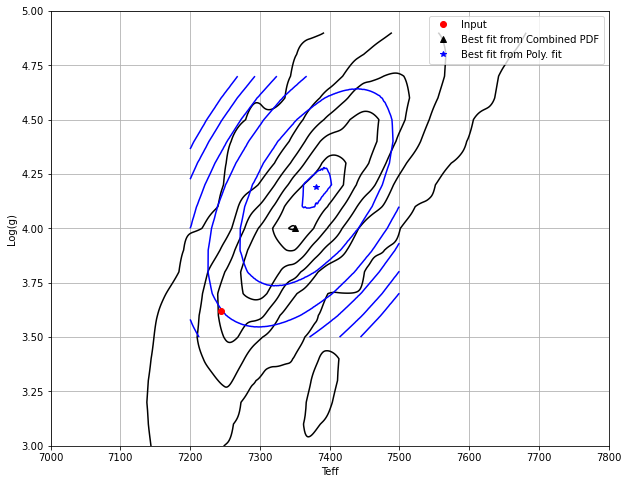
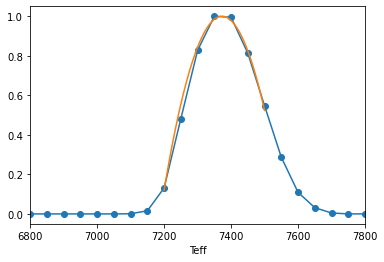
      In order to derive the best fit stellar model based on the combined probability function of P_photometry and P_spectrum, we re-grid the stellar parameters. The best fit spectrum is extracted from the RBF model (PIPE2D-460). 

        Attachments

        1. Logg.png
          Logg.png
          15 kB
        2. Teff_Logg.png
          Teff_Logg.png
          73 kB
        3. Teff.png
          Teff.png
          13 kB

          Issue Links

            Activity

            Hide
            takuji.yamashita Takuji Yamashita added a comment -

            In order to do regrid the stellar parameters and find the best-fit model, I did the polynomial fitting of a combined P(Teff, log(g)). The original steps of P(Teff, log(g)) before the regridding is 50 K in Teff and 0.25 in log(g/(cm/s^2)), respectively.
             
            Example:
            Simulation spectrum: Teff=7245K, log(g)=3.62, Z=-0.2, [a/Fe]=0.25, r_mag = 15.0
             
            Marginal probability distribution functions (PDF) along Teff and log(g). The original PDFs (blue) and polynomial fit (orange). The fitting was done only around the peak of the original PDF.


            The PDF contours of the original (black) and the polynomial fit (blue). The polynomial fitting of P(Teff, log(g)) finds the best-fit model at its peak (a blue star), although this stellar typing itself has a systematic offset from the input Teff and log(g).


            Show
            takuji.yamashita Takuji Yamashita added a comment - In order to do regrid the stellar parameters and find the best-fit model, I did the polynomial fitting of a combined P(Teff, log(g)). The original steps of P(Teff, log(g)) before the regridding is 50 K in Teff and 0.25 in log(g/(cm/s^2)), respectively.   Example: Simulation spectrum: Teff=7245K, log(g)=3.62, Z=-0.2, [a/Fe] =0.25, r_mag = 15.0   Marginal probability distribution functions (PDF) along Teff and log(g). The original PDFs (blue) and polynomial fit (orange). The fitting was done only around the peak of the original PDF.     The PDF contours of the original (black) and the polynomial fit (blue). The polynomial fitting of P(Teff, log(g)) finds the best-fit model at its peak (a blue star), although this stellar typing itself has a systematic offset from the input Teff and log(g).    

              People

              • Assignee:
                takuji.yamashita Takuji Yamashita
                Reporter:
                takuji.yamashita Takuji Yamashita
                Reviewers:
                hassan
              • Votes:
                0 Vote for this issue
                Watchers:
                Start watching this issue

                Dates

                • Created:
                  Updated:
                  Resolved: