Uploaded image for project: 'DRP 2-D Pipeline'
  1. DRP 2-D Pipeline
  2. PIPE2D-1735

Set appropriate threshold value of sigma for bad fibers in fiberNormsQa plot

    XMLWordPrintable

    Details

    • Type: Task
    • Status: Open (View Workflow)
    • Priority: Normal
    • Resolution: Unresolved
    • Affects Version/s: None
    • Fix Version/s: None
    • Component/s: drp_qa
    • Labels:
    • Sprint:
      postRun23

      Description

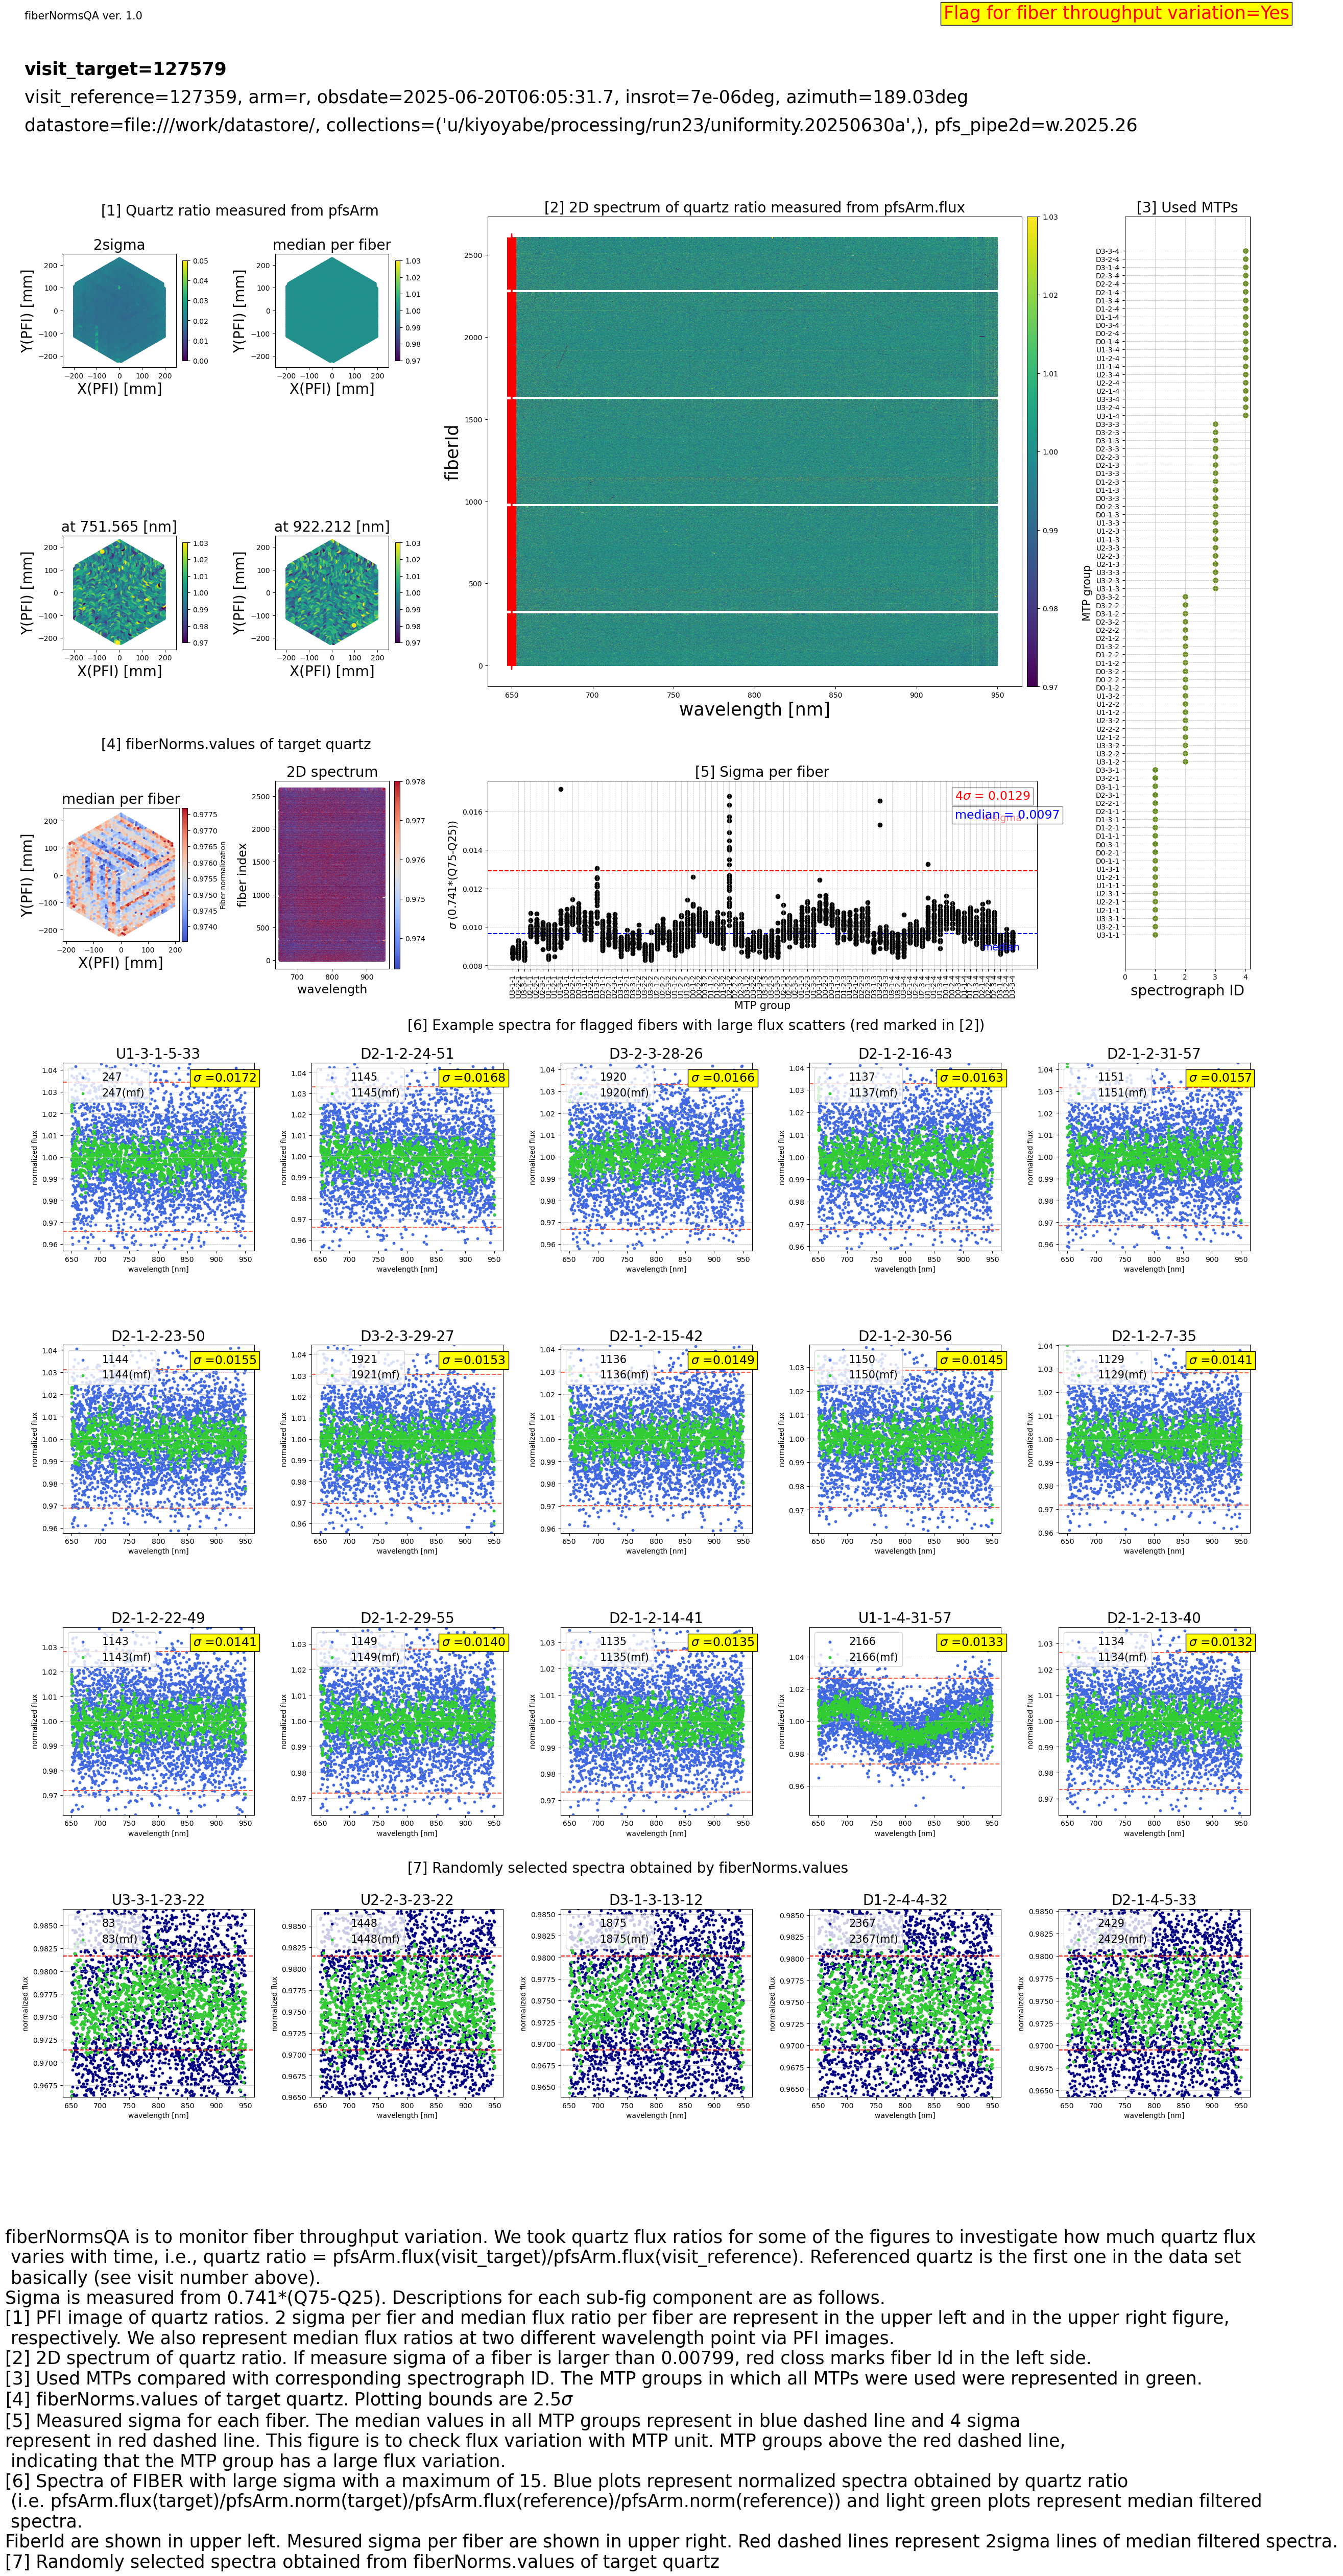
      In the latest fiberNormsQa plot, the red indicator for bad fibers in terms of sigma is show for basically all fibers. Please update the threshold (set it properly if it possible depends on exposure time).
      The example plot is here:

        Attachments

          Activity

            People

            • Assignee:
              AyumiTK Ayumi Takahashi
              Reporter:
              kiyoto.yabe Kiyoto Yabe
            • Votes:
              0 Vote for this issue
              Watchers:
              1 Start watching this issue

              Dates

              • Created:
                Updated: