-
Type:
Task
-
Status: Done (View Workflow)
-
Priority:
Normal
-
Resolution: Done
-
Affects Version/s: None
-
Fix Version/s: None
-
Component/s: None
-
Labels:
-
Epic Link:
-
Sprint:postRun19Oct
A small fraction of FLUXSTDs in a given visit have almost no fluxes despite that these are bright objects. Investigate why we are missing fluxes for these objects.
Update with results:
Visits: 115021, 115022, 115028, 115029, 115049, 115050, 115066, 115067
Rerun: 20241002
Calib: CALIB-2024-07-v7
Run: 18
As described above, a small fraction of FLUXSTDs show significant flux loss in run 18 visits. By analysing the visits noted above, we find that the this is mainly caused by large fiber offsets. The results are as follows:
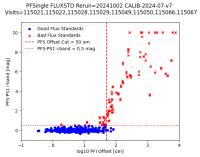
- We looked at the PFS-PS1 i-band magnitude difference for all FLUXSTDs in each visit. FLUXSTDs naturally exhibit a scatter of +/- 0.2~0.3 mags (being separately investigated), thus we implement a loose cut at PFS-PS1 = 0.5 and define all objects above “bad” FLUXSTDs (i.e. stars with significant flux loss) and anything below as “good” FLUXSTDs.
- In the first figure we plot for all FLUXSTDs the PFS-PS1 i-band magnitude vs log10 PFIoffsets (micron). Here we show the good and bad FLUXSTDs as defined above, along with the PFS-PS1=0.5 cut and the current notConvergedDistanceThreshold of 50um (see ticket
INSTRM-2381). The PFIoffsets are calculated using the PFI Nominal and PFI Center data from PFSsingle.observations and the equation: pfioff = sqrt( (pfinominal_x - pficenter_x)^2 + (pfinominal_y - pficenter_y)^2 )
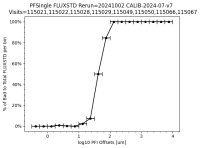
- In the second figure we separate out the FLUXSTDs in bins of log10 PFIoffsets = 0.25um from -0.5 < log10 PFIoffsets < 4. We then plot the percentage of bad FLUXSTDs to total FLUXSTDs (good+bad) in each bin as a function of log10 PFIoffsets. From this plot we can see that the number of bad FLUXSTDs significantly increases beyond log10 PFIoffsets > 1.4, or 25um. Thus it may be more appropriate to set the notConvergedDistanceThreshold to 25um based on these results.
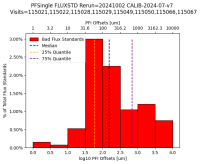
- In the third figure we show a histogram with the percentage of bad FLUXSTDs to total FLUXSTDs across all visits (not per bin as above) as a function of PFIoffsets to look at the overall statistics of such objects. Generally these low flux stars account for around ~5% of total.
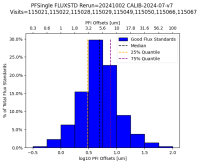
- Fourth figure is the same as the third but for the good FLUXSTDs.
- relates to
-
PIPE2D-1518 fix flux normalization variation in flux calibration
-
- Done
-


