Uploaded image for project: 'DRP 2-D Pipeline'
  1. DRP 2-D Pipeline
  2. PIPE2D-1423

Make a command-line task for flux calibration QA

    Details

    • Sprint:
      preRun18August1

      Description

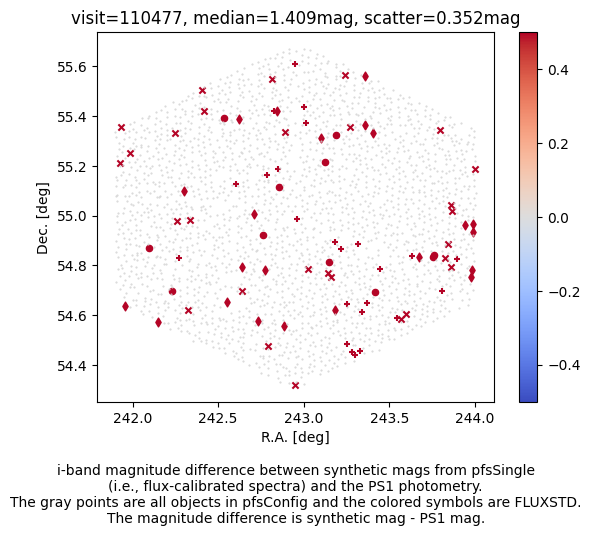
      Please make the flux calibration QA as a command-line task. Currently, Masayuki Tanaka is assigned but can be changed later for the actual implementation.

        Attachments

        1. v110477-tanaka.png
          v110477-tanaka.png
          87 kB
        2. v110477-mag-diff.png
          v110477-mag-diff.png
          524 kB
        3. v110478-mag-diff.png
          v110478-mag-diff.png
          532 kB
        4. v110478-tanaka.png
          v110478-tanaka.png
          89 kB

          Activity

          Hide
          wtgee Wilfred Gee added a comment -

          I've started working on moving this into drp_qa and should have a PR within a day (or so). I've copied the synthmag and fulxCalQaScript.py, so please let me know if the originals change for any reason.

          Show
          wtgee Wilfred Gee added a comment - I've started working on moving this into drp_qa and should have a PR within a day (or so). I've copied the synthmag and fulxCalQaScript.py , so please let me know if the originals change for any reason.
          Hide
          wtgee Wilfred Gee added a comment -

          Comparison between plots produced by Masayuki Tanaka original code vs the fluxCalQa.py.  The command line produces all filters in a single plot, so the comparison is just between the i. The median values are similar (both bad in 110477 and both good in 110478). The scatter/rms values differ slightly and by-eye there appear to be a few different outliers.

          Show
          wtgee Wilfred Gee added a comment - Comparison between plots produced by Masayuki Tanaka  original code vs the fluxCalQa.py.  The command line produces all filters in a single plot, so the comparison is just between the i . The median values are similar (both bad in 110477 and both good in 110478 ). The scatter/rms values differ slightly and by-eye there appear to be a few different outliers.
          Hide
          price price added a comment -

          What's the significance of circles, diamonds, + and x?

          Show
          price price added a comment - What's the significance of circles, diamonds, + and x?
          Hide
          wtgee Wilfred Gee added a comment -

          The markers correspond to the spectrograph. On the newer plots (with all the filters) there is a legend in the upper right. The markers are not consistent between the old plots and new.

          Show
          wtgee Wilfred Gee added a comment - The markers correspond to the spectrograph. On the newer plots (with all the filters) there is a legend in the upper right. The markers are not consistent between the old plots and new.
          Hide
          wtgee Wilfred Gee added a comment -

          This has been merged, making the fluxCalQa.py script available via the command line. Further improvements to the QA should be in new tickets.

          Show
          wtgee Wilfred Gee added a comment - This has been merged, making the fluxCalQa.py script available via the command line. Further improvements to the QA should be in new tickets.

            People

            • Assignee:
              wtgee Wilfred Gee
              Reporter:
              kiyoto.yabe Kiyoto Yabe
              Reviewers:
              Kiyoto Yabe
            • Votes:
              0 Vote for this issue
              Watchers:
              Start watching this issue

              Dates

              • Created:
                Updated:
                Resolved: