-
Type:
Story
-
Status: Open (View Workflow)
-
Priority:
Normal
-
Resolution: Unresolved
-
Component/s: None
-
Labels:None
We have processed the COSMOS and GA spectra of the April 23 run, using the latest production (Dec 8). The first remark is that spectra edges are either not properly flagged or that variance is underestimated, especially at the red end of the red arm. We thus run the 1D pipeline on the (quite conservative) 4000-9000 range.
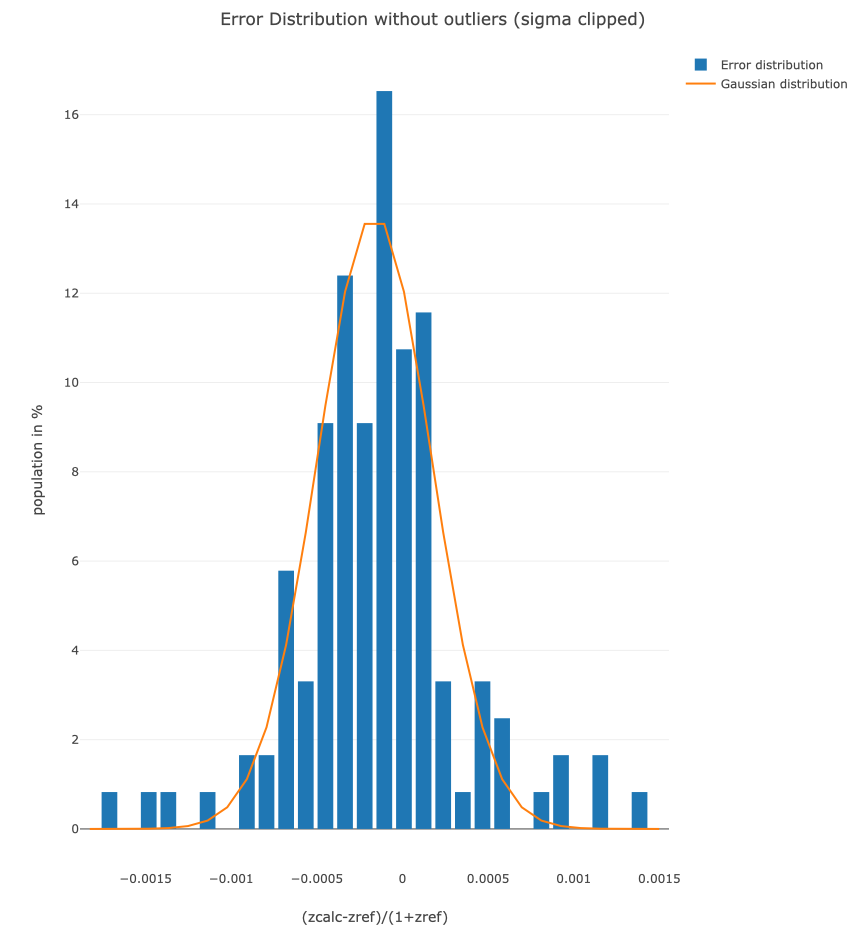
On the COSMOS galaxy sample (790 galaxies in the redshift range 0.6 to 1.35, for which the OII doublet is expected in the wavelength range, the global success rate on the redshift measurement is low, about 15% at the relative error of 0.001). On the other side, the precision on the successful measurements is good, with an average value of relative error of 1.5e-4, and a a dihttps://pfspipe.ipmu.jp/jira/browse/PIPE1D-77#spersion of 3e-4, leading to a 3sigma value of 0.001 for the precision of the redshift measurement
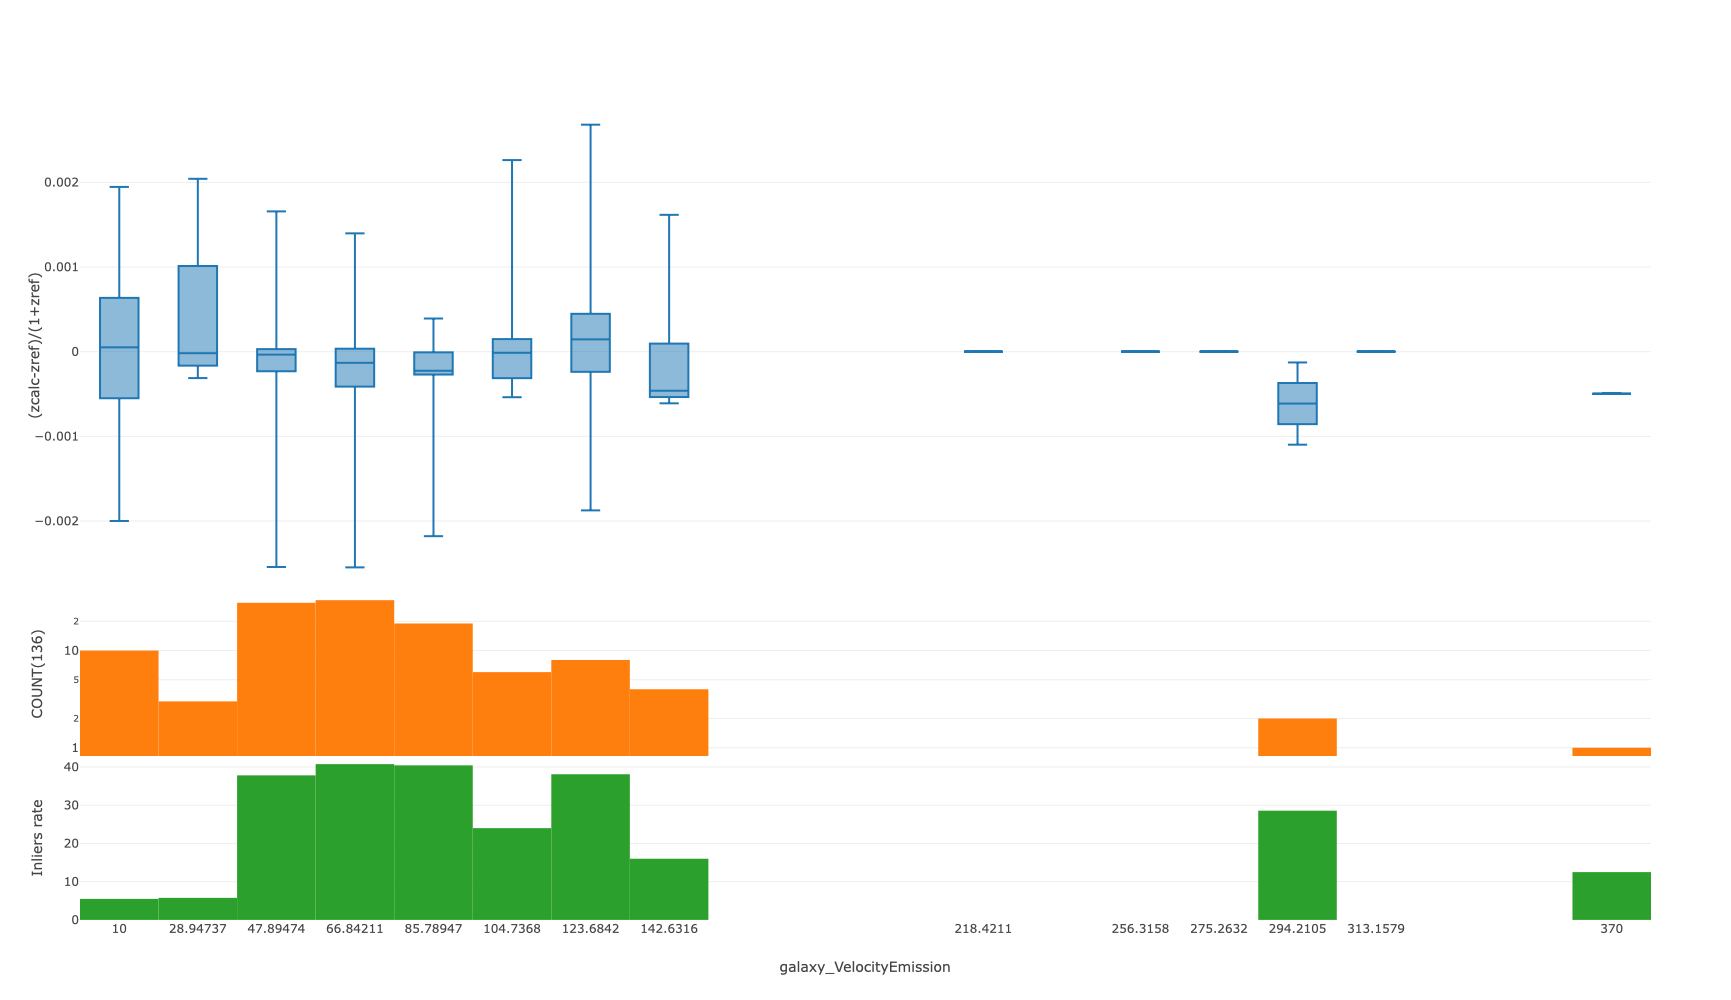
When plotting the success rate as a function of the fitted velocity dispersion of the emission lines, it appears obvious (green histogram at the bottom) that there are a lot of wrong measurements with very low velocity dispersion (below 50 km/s) , which corresponds to narrow spikes in the spectra that are not flagged and that are mistaken for emission lines. The value of 50 km/s might not be meaningful as it depends on the precision of the LSF width estimation, but
Here is an exemple of such spectrum
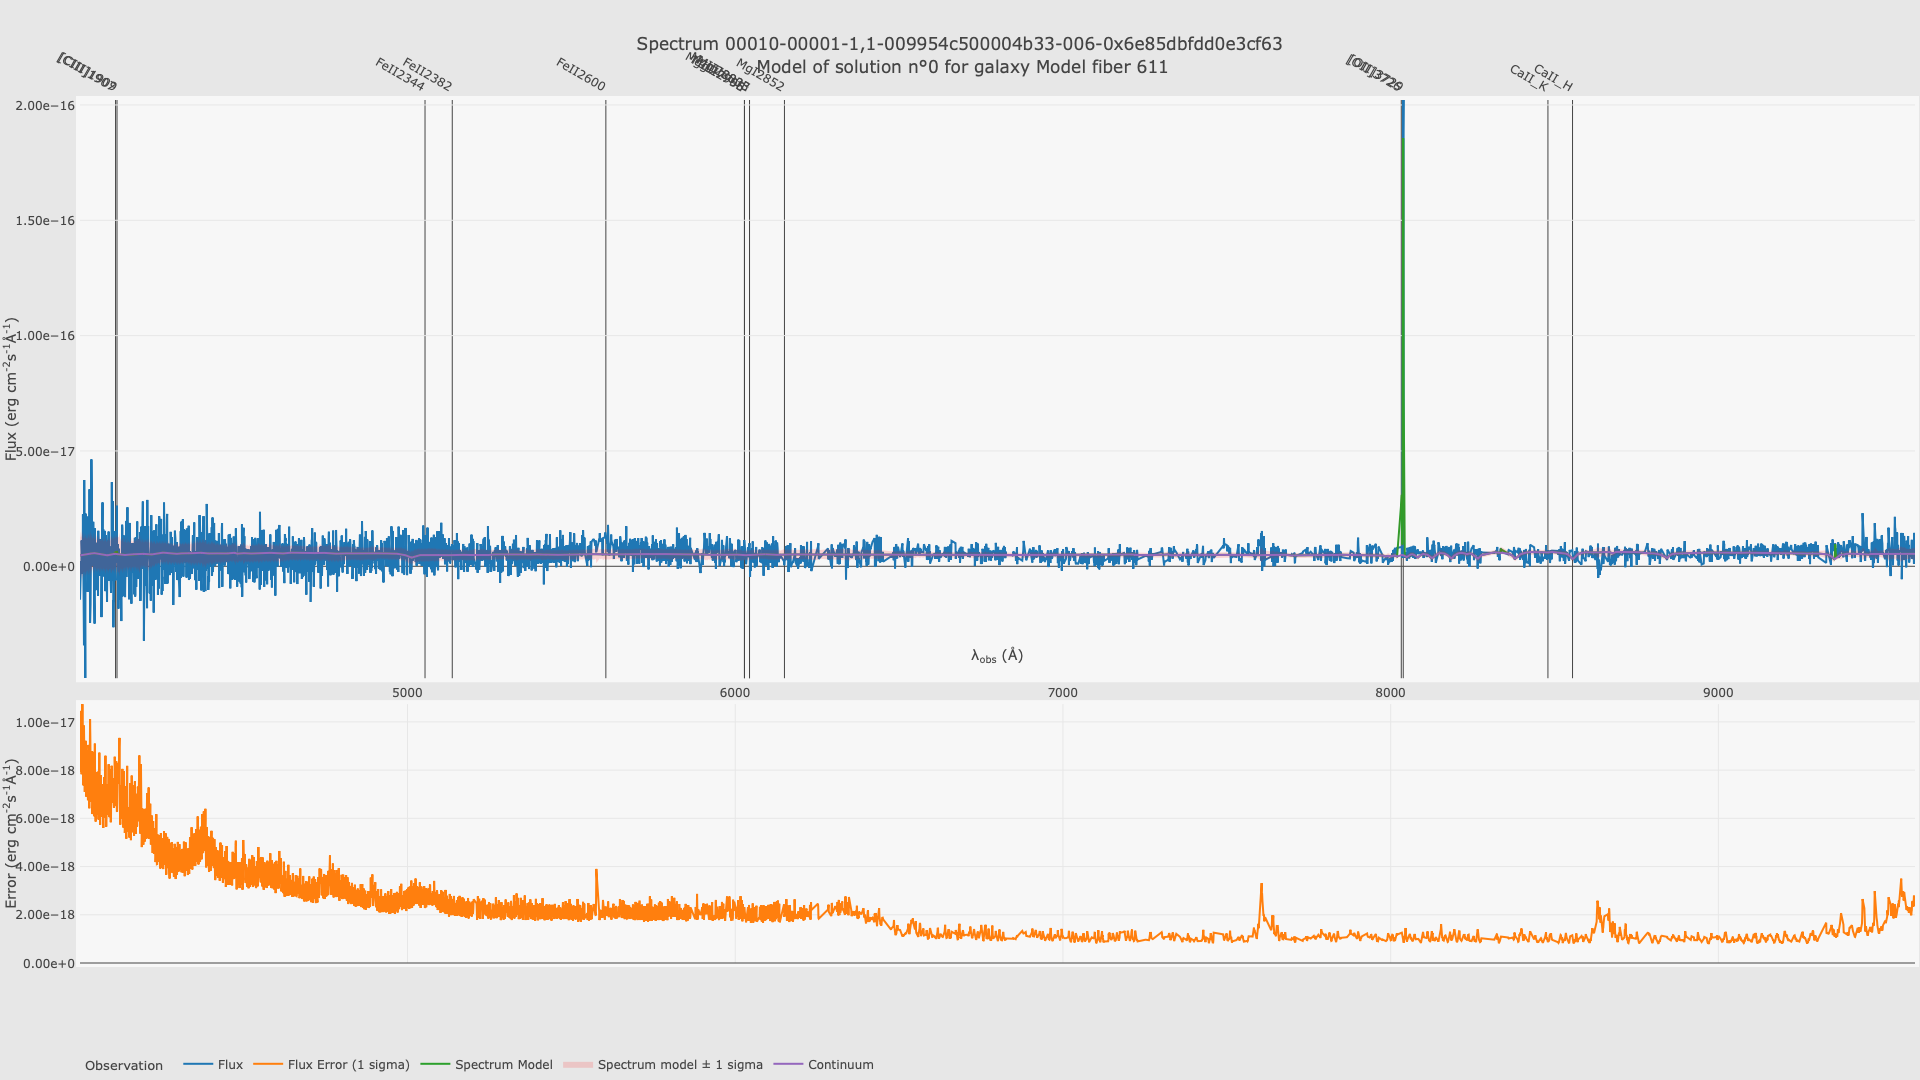
where the velocity is measured at the mimimum allowed value.
The remaining sample contains 550 spectra (with Reference redshift < 1.35 and velocity dispersion > 50 km/s).
When selecting spectra on which the SNR of OII emission lines is greater than 5, the success rate reaches 50% at the 0.002 relative error (which allows measurement based on continuum) for the 304 relevant spectra. Hence some features in the spectra still produce features that mimic strong emission lines.
Regarding background subtraction, it is an issue for 150 spectra among the full 831, for those the pipeline detects a negative amplitude for the continuum template, and shifts to a median filtering of the continuum
Below is an example of such spectrum
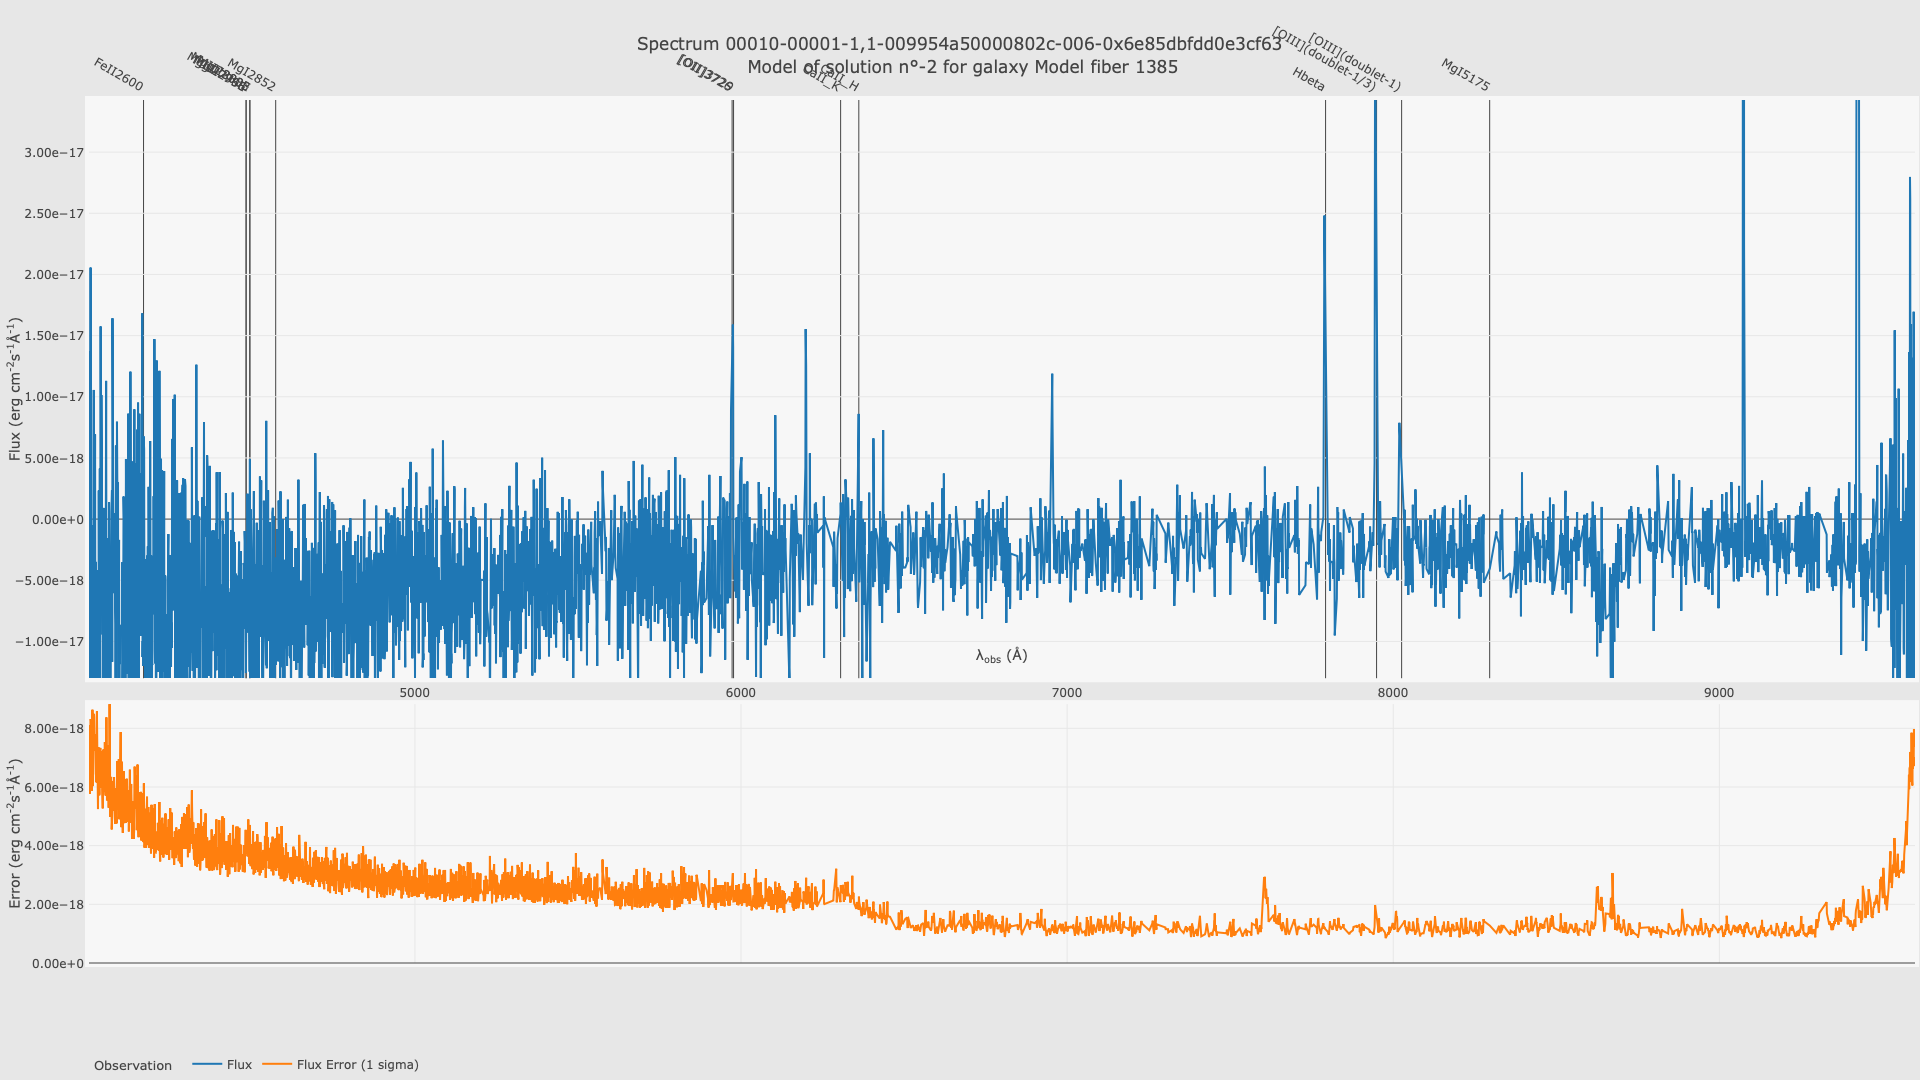
Beside the oversubtraction I noticed that the emission lines that are labeled on the spectrum (OII, H-Beta and OIII) are not at the expected position when calculated from the reference redshift. On the image above I have used a manually estimated value of 0.6025, whereas the value in the catalog is 0.6082. This corresponds to a 25A shift, indicating som issue with wavelength calibration.
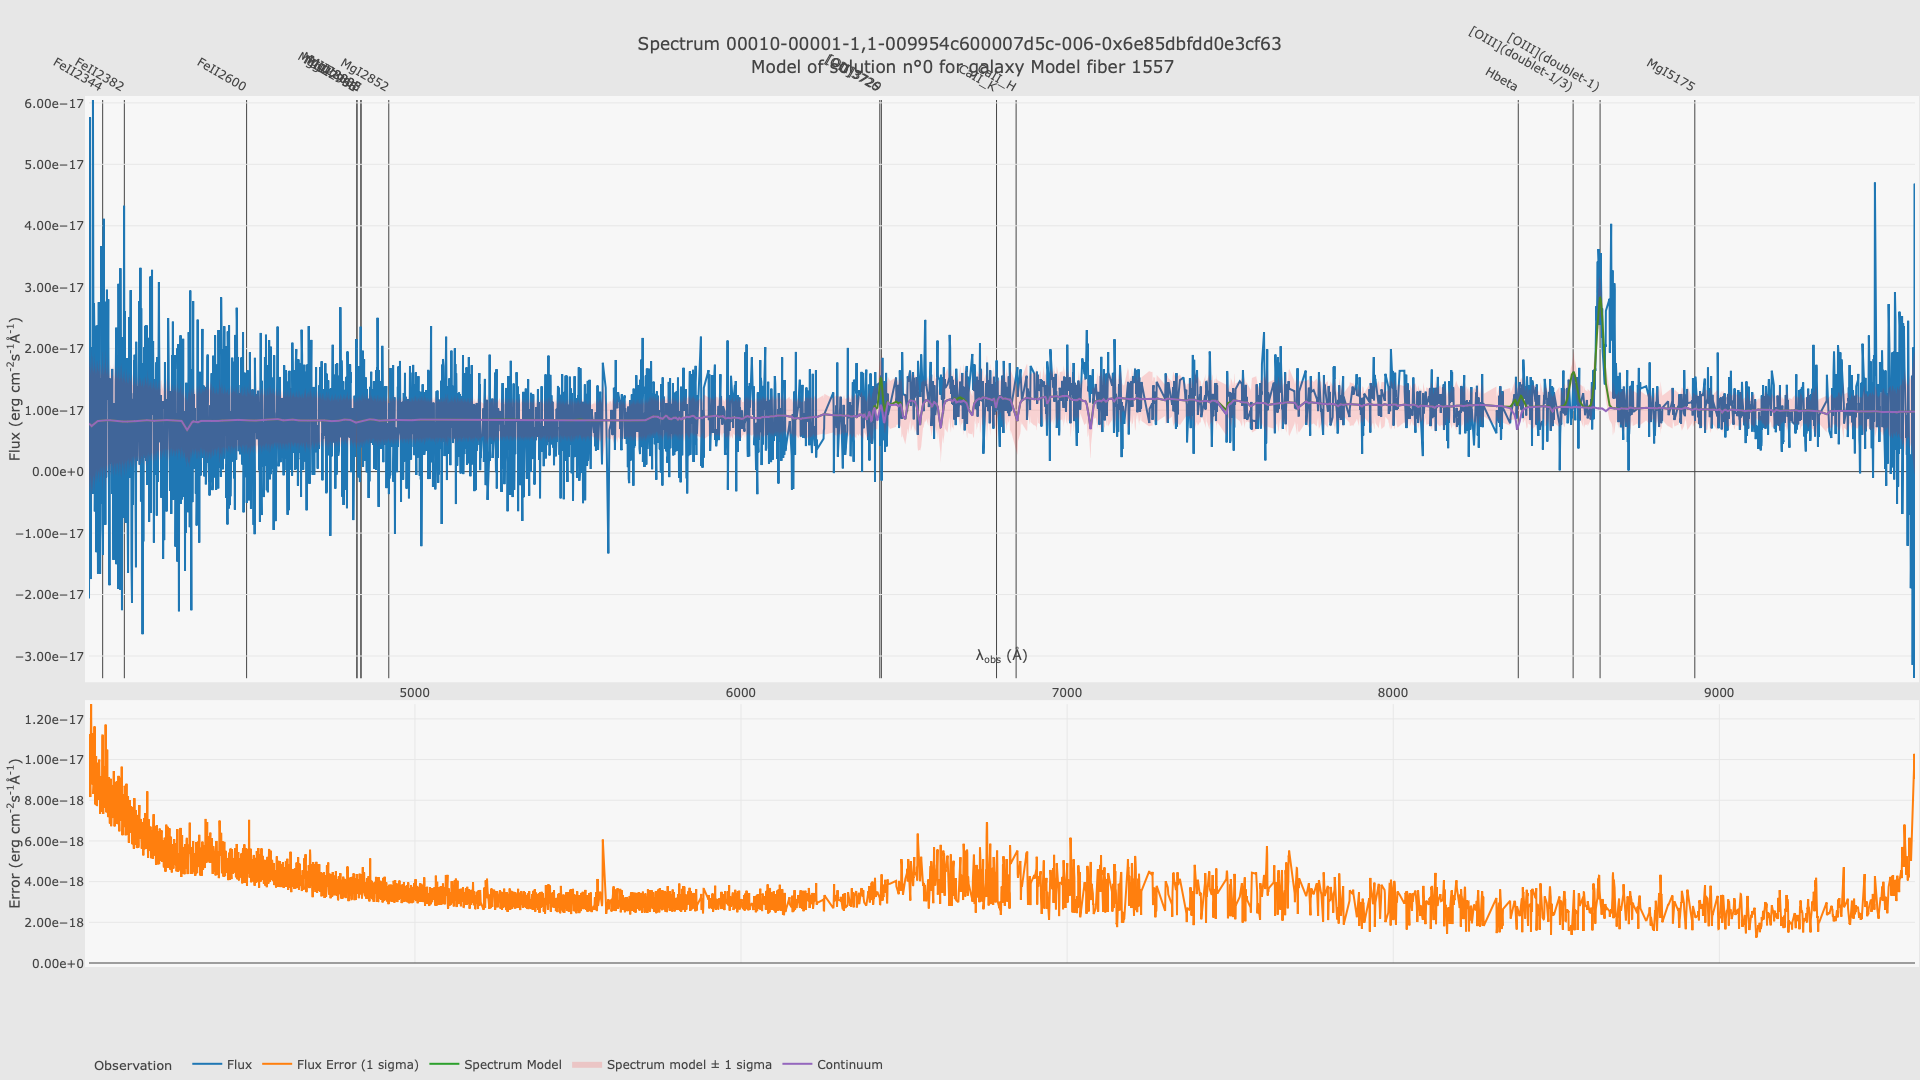
On a large number of spectra I noticed a fake fixed feature covering 8620- 8670 A which is not real and produces wrong redshift (detected but horizontal strips in the z_ref vs z_measured plot, as a fixed feature produces several measured similar values)
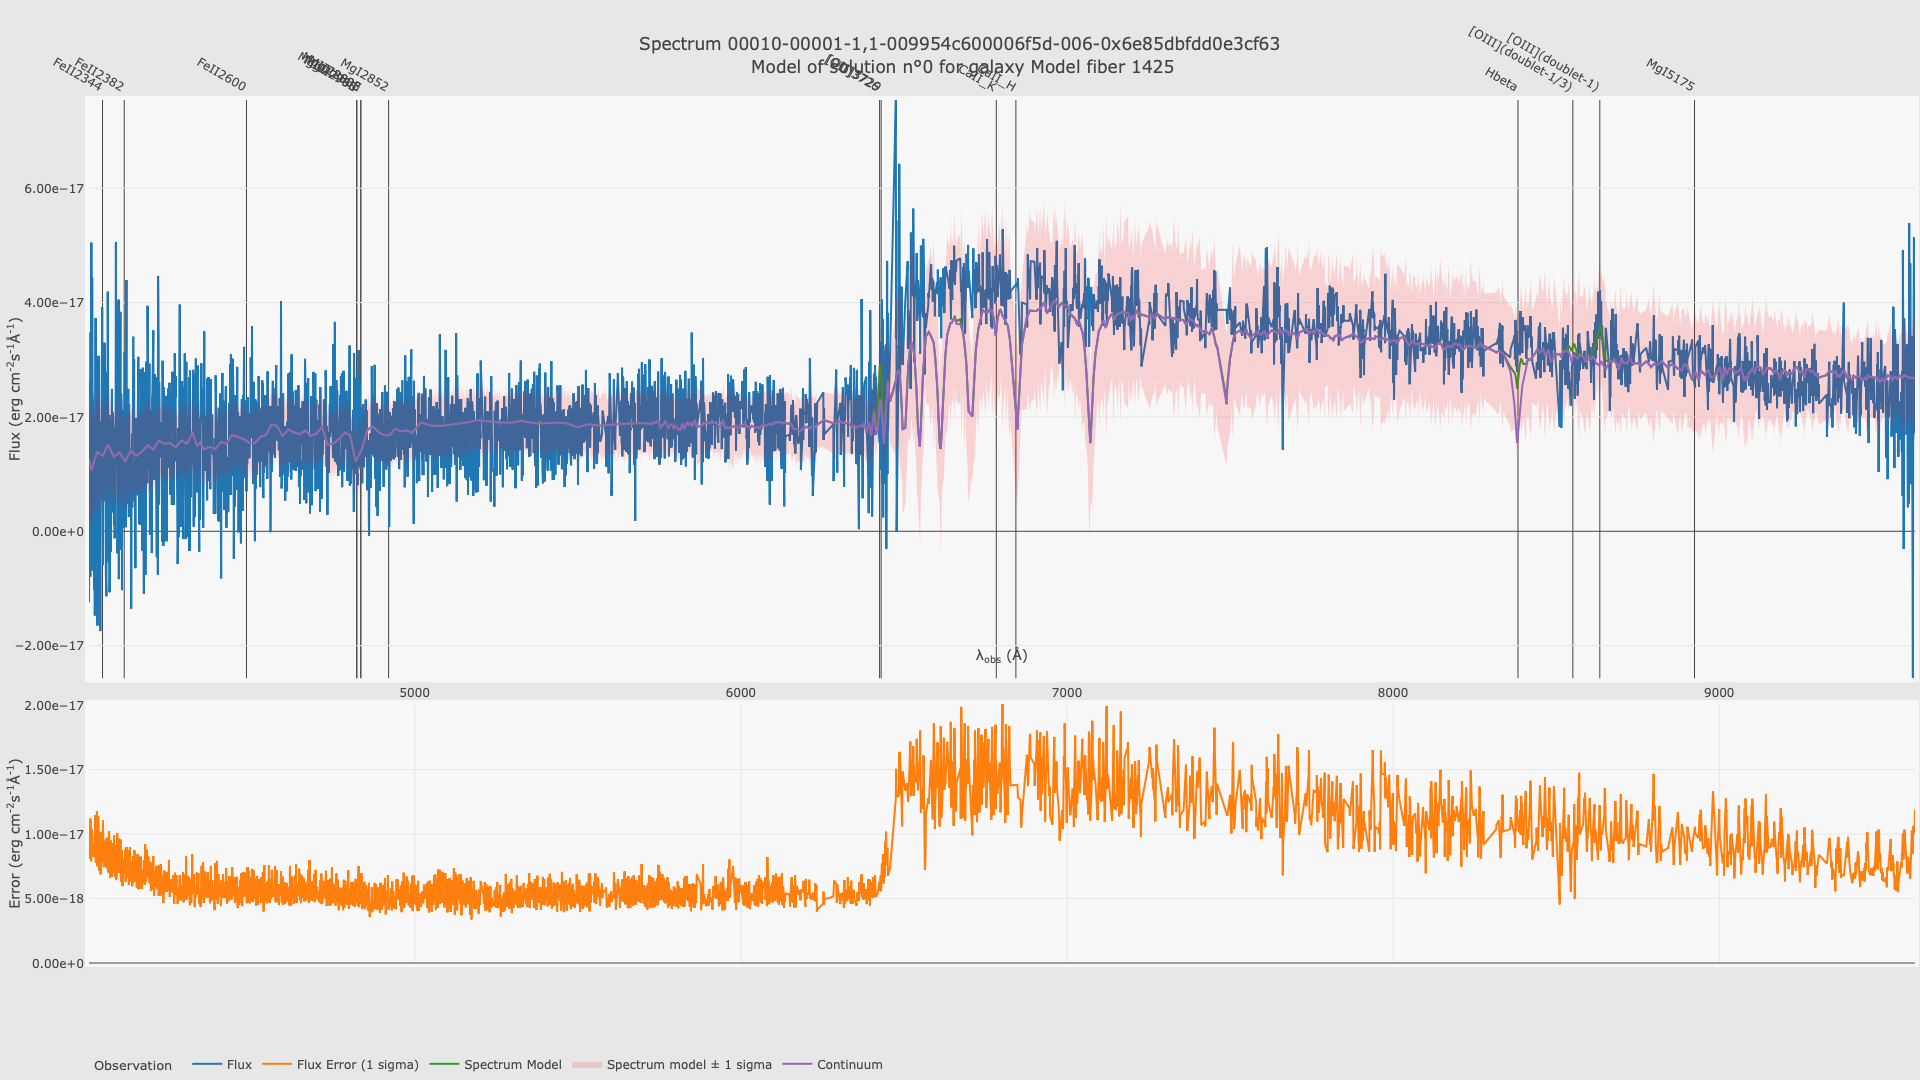
On other spectra there is differential flux calibration (probably between blue and red, and with an overestimated variance in the red) that also produces wrong redsfhifts
Regarding the release of those data to the science working groups, it may be good to consider a masking of the 8620-8670 region (on the relevant spectra if the cause can be identified, or on all spectra otherwise) and to solve the wavelength calibration issue before releasing. Otherwise very strong caveats will have to be put on the quality of the measurements. The positive point is that the features needed to properly measure the redshift seem to be present in the spectra, they are just superseded by other features.
- relates to
-
PIPE2D-1366 Unflagged narrow spikes in EDR2 spectra
-
- Done
-
-
PIPE2D-1345 Oversubtraction in EDR2 spectra
-
- Done
-
-
PIPE2D-1364 Investigate a dichroic discontinuity in EDR2 spectra
-
- Open
-
-
PIPE2D-1363 Investigate a fake line feature at around 865nm in EDR2 spectra
-
- Done
-