-
Type:
Task
-
Status: Open (View Workflow)
-
Priority:
Normal
-
Resolution: Unresolved
-
Component/s: None
-
Labels:
-
Epic Link:
Brief summary of the persistence analysis of N1 array
By analyzing the experiment data of the PFS N1 array taken in 2020-12, the following persistence properties were revealed. See the attached pdf for details.
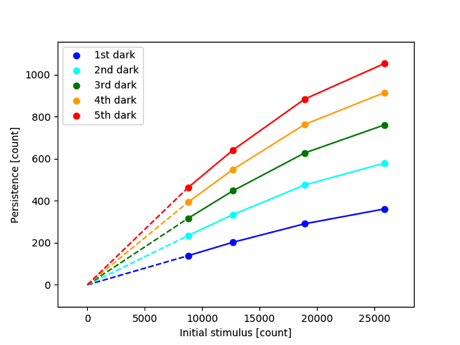
(1) The linear relation between the initial stimulus and the persistence
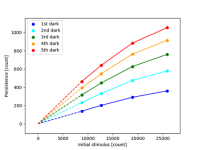
In the range of 8000-20000 counts, the persistence signals increase linearly with the increase of the initial stimulus. At >20000 counts, the persistence seems to saturate slightly.
(2) The persistence decaying time constants and persistence map
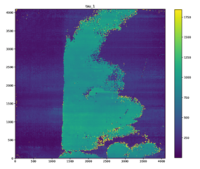
By fitting a function to the persistence curve of each area of the array, the array is found to consist of the two distinct regions, whose persistence have different decaying properties.

The decaying time constants were not constant among the datasets, but seemed to depend on the initial stimulus. However, it is possible that the variation of the time constant was caused by the contamination of the persistence from the other datasets. It is necessary to reveal whether the time constants really depend on the initial stimulus by taking a new data without the contamination of the persistence from the other datasets.
Suggestion for the next experiment for the characterization of the persistence
At first, a dataset of a flat frame and dark frames with typical parameters should be taken and analyzed in order to know the typical timescale for the release of the trapped electrons.
The timescale is important for estimating the necessary waiting time between the datasets.
As the next step, following issues should be examined about the N2 array for the characterization of the persistence.
- The relation between the persistence and initial stimulus.
- The initial stimulus where the persistence saturates.
- Take datasets of a flat frame and dark frames by changing the illumination level of the flat lamp. The exposure time of the flat frame should not be changed among the datasets in order to see only the dependence on the initial stimulus.
- Taking a new dataset should start after all of the electrons trapped by the previous exposures are released.
- Wide range of the illumination level should be covered in order to see the linearity between the persistence and the initial stimulus.
- The relation between the persistence and soak time (exposure time).
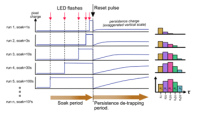
- Take datasets of a flat frame and dark frames by changing the exposure time of the flat frames. The total counts of the flat frame should not be changed among the datasets in order to see only the dependence on the exposure time. Ideally, the experiment shown in the attached figure (Tulloch & George 2019, Figure 7) would be the best way to see the dependence on the exposure time.
- Taking a new dataset should start after all of the electrons trapped by the previous exposures are released.
- Especially, it is important to take a dataset with the flat exposure time that is similar to the actual exposure time planned in the astronomical observations and calibration.
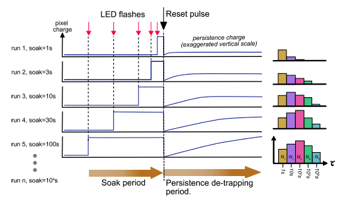
(Add Dec., 21, 2021)
A PDF containing the preliminary results of the N2 persistence data and a request for the data acquisition is attached.
* Dark without persistence
-
- Count rate of the dark current was estimated from the last 10 frames of the 3rd run. Although the persistence signal seems to disappear in those frames, it is possible that the long-lasting persistence component is contaminated. Therefore, the dark data without persistence signal should be obtained.
- About 10 dark frames with the same setting (exposure time, NDR, IRP, gain, etc.) are probably enough for achieving enough S/N.
- A variety of soak time
- With the current dataset, the persistence dependence on the soak time was found. More datasets with various soak time are necessary for understanding the persistence properties more precisely.
- For example, the persistence data with soak time = 450 sec and 900 sec should be obtained considering planned PFS operation.
uDataset for testing the persistence model - If we construct some persistence model based on the current dataset, the validity of the model should be checked with the other data which is not used in constructing the model.
