[PIPE2D-1423] Make a command-line task for flux calibration QA Created: 20/Apr/24 Updated: 03/Aug/24 Resolved: 03/Aug/24 |
|
| Status: | Done |
| Project: | DRP 2-D Pipeline |
| Component/s: | drp_qa |
| Affects Version/s: | None |
| Fix Version/s: | None |
| Type: | Task | Priority: | Normal |
| Reporter: | Kiyoto Yabe | Assignee: | Wilfred Gee |
| Resolution: | Done | Votes: | 0 |
| Labels: | EngRun, QualityAssurance | ||
| Remaining Estimate: | Not Specified | ||
| Time Spent: | Not Specified | ||
| Original Estimate: | Not Specified | ||
| Attachments: |
|
| Sprint: | preRun18August1 |
| Reviewers: | Kiyoto Yabe |
| Description |
|
Please make the flux calibration QA as a command-line task. Currently, Masayuki Tanaka is assigned but can be changed later for the actual implementation. |
| Comments |
| Comment by Masayuki Tanaka [ 24/Apr/24 ] |
|
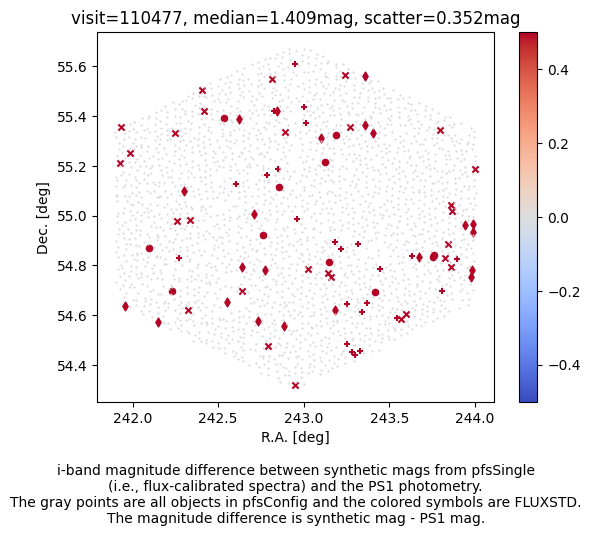
For the coming engineering run, I put a script version of the fluxCalQA at /work/tanaka/fluxcalqa/fluxCalQaScript.py You can launch it this way: $ python fluxCalQaScript.py rerun visit outputDir For example, $ python fluxCalQaScript.py rerun/kiyoyabe/erun/run15/20240328 107831 /work/tanaka/fluxcalqa/ This will generate two plots: one is i-mag difference between pfsSingle and PS1 photometry for FLUXSTDs, and the other is g-y color. I have shown these plots at telecons and slack, and you should be able to read them (if not, let me know). |
| Comment by Masayuki Tanaka [ 24/Apr/24 ] |
|
It also dumps summary stats in the log: fluxCalQAStats: visit median(imagDiff) sigma(imagDiff) median(colorDiff) sigma(colorDiff) Please grep. |
| Comment by Kiyoto Yabe [ 24/Jun/24 ] |
|
It looks that /home/tanaka/processing/synthmag is not accessible so I couldn't import the module. Could you copy them to somewhere accessible (e.g. /work/tanaka/fluxcalqa/)? |
| Comment by Kiyoto Yabe [ 24/Jun/24 ] |
|
I found that there was `/work/tanaka/processing/synthmag/`. Is it the same as `/home/tanaka/processing/synthmag/`? |
| Comment by Masayuki Tanaka [ 24/Jun/24 ] |
|
I forgot to change the permission of my home directory, but all of my work is in /work/tanaka/. /home/tanaka/processing/synthmag/ and /work/tanaka/processing/synthmag/ are the same directory as you guessed. |
| Comment by Wilfred Gee [ 25/Jun/24 ] |
|
I assume this will end up in the drp_qa repo, so I can help set that up if needed. |
| Comment by Kiyoto Yabe [ 25/Jun/24 ] |
|
| Comment by Masayuki Tanaka [ 27/Jun/24 ] |
|
I will fix the code when I get a chance. Please leave the rerun and visit numbers you looked at in this ticket, so I can reproduce the problem. |
| Comment by Kiyoto Yabe [ 28/Jun/24 ] |
|
I'm not sure which one is used for the report above but probably the same in both. This script file includes my hacks.
python /work/kiyoyabe/erun/run17/calibs/generateCalibs/20240619/scripts/fluxCalQaScript.py rerun/kiyoyabe/erun/run17/20240528 111347 /work/kiyoyabe/erun/run17/calibs/generateCalibs/20240619/qa/old /work/drp/CALIB
python /work/kiyoyabe/erun/run17/calibs/generateCalibs/20240619/scripts/fluxCalQaScript.py rerun/kiyoyabe/calibs/run17/20240619/science 111347 /work/kiyoyabe/erun/run17/calibs/generateCalibs/20240619/qa/new /work/kiyoyabe/erun/run17/calibs/generateCalibs/20240619/CALIB-kiyoyabe-20240619
|
| Comment by Wilfred Gee [ 10/Jul/24 ] |
|
I've started working on moving this into drp_qa and should have a PR within a day (or so). I've copied the synthmag and fulxCalQaScript.py, so please let me know if the originals change for any reason. |
| Comment by Wilfred Gee [ 01/Aug/24 ] |
|
Comparison between plots produced by Masayuki Tanaka original code vs the fluxCalQa.py. The command line produces all filters in a single plot, so the comparison is just between the i. The median values are similar (both bad in 110477 and both good in 110478). The scatter/rms values differ slightly and by-eye there appear to be a few different outliers.
|
| Comment by price [ 01/Aug/24 ] |
|
What's the significance of circles, diamonds, + and x? |
| Comment by Wilfred Gee [ 01/Aug/24 ] |
|
The markers correspond to the spectrograph. On the newer plots (with all the filters) there is a legend in the upper right. The markers are not consistent between the old plots and new. |
| Comment by Wilfred Gee [ 03/Aug/24 ] |
|
This has been merged, making the fluxCalQa.py script available via the command line. Further improvements to the QA should be in new tickets. |