[PIPE2D-1373] Allow for different data scaling on DM QA Created: 29/Feb/24 Updated: 02/Mar/24 Resolved: 02/Mar/24 |
|
| Status: | Done |
| Project: | DRP 2-D Pipeline |
| Component/s: | drp_qa |
| Affects Version/s: | None |
| Fix Version/s: | None |
| Type: | Task | Priority: | Major |
| Reporter: | Wilfred Gee | Assignee: | Wilfred Gee |
| Resolution: | Done | Votes: | 0 |
| Labels: | EngRun, QualityAssurance | ||
| Remaining Estimate: | Not Specified | ||
| Time Spent: | Not Specified | ||
| Original Estimate: | Not Specified | ||
| Attachments: |
|
| Epic Link: | DetectorMap QA improvements |
| Sprint: | Engrun15Mar |
| Reviewers: | Kiyoto Yabe |
| Comments |
| Comment by Wilfred Gee [ 29/Feb/24 ] |
|
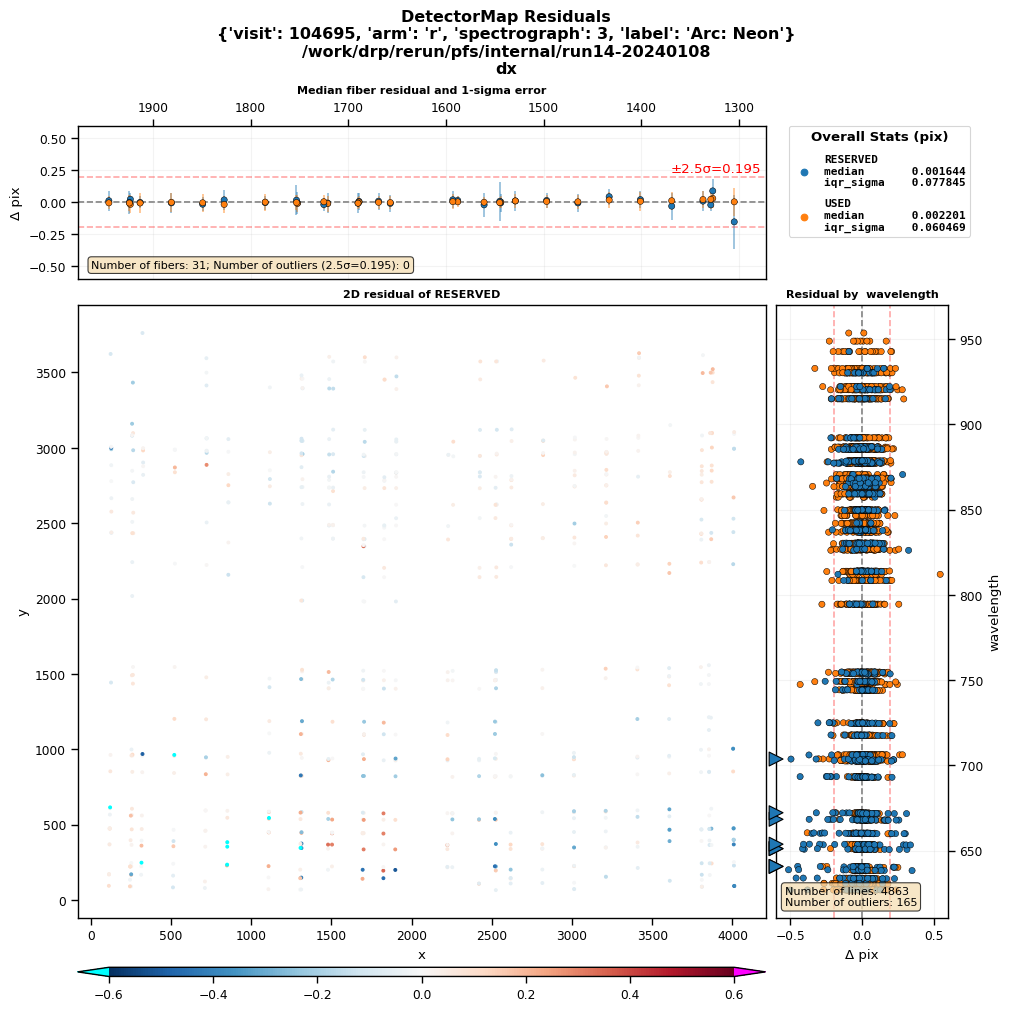
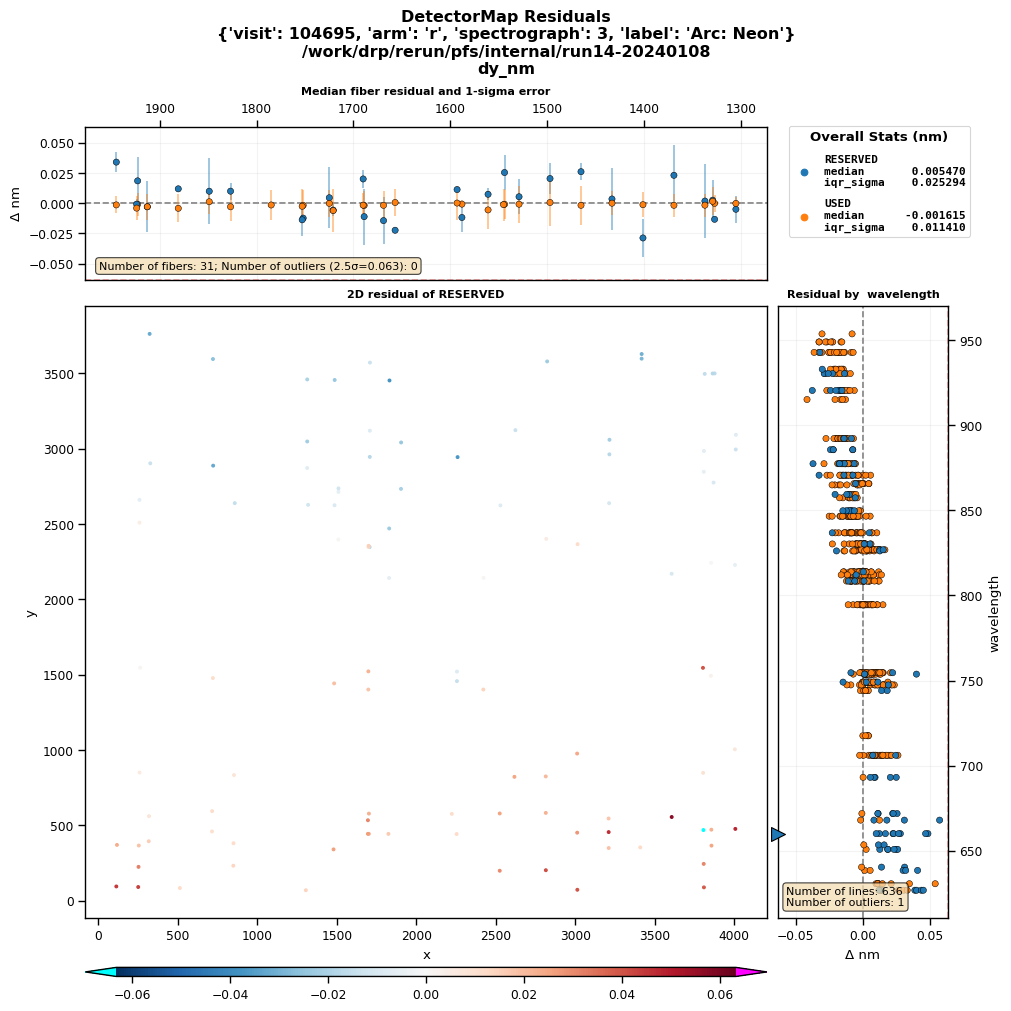
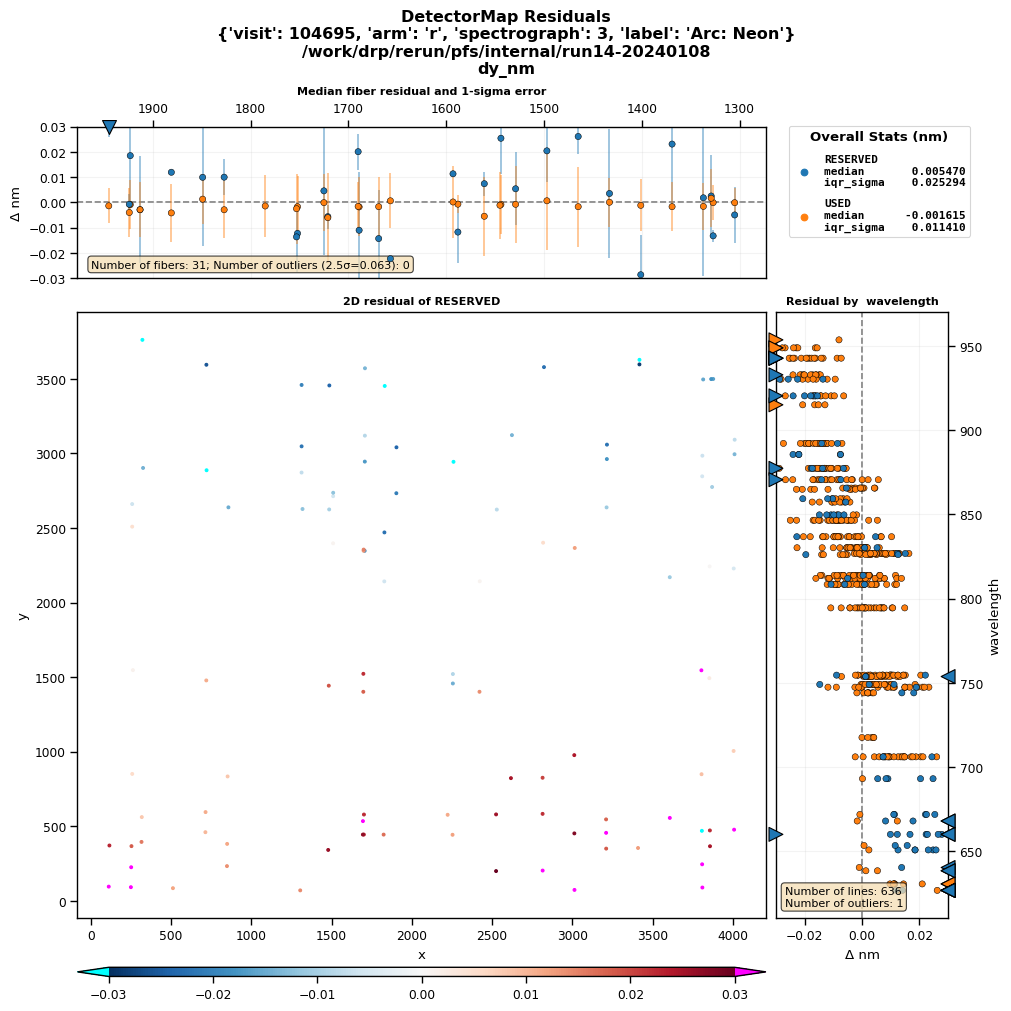
I've made the scale limits on the detectormap qa residual configurable. the plotResidual function accepts vmin and vmax arguments, which default to None, which will set the range to ±2.5 * iqr_sigma. If the limits are provided and are larger than the sigma range, that range will be marked with a dashed line and some text (see attached plots). I've attached four plots, two for the spatial residual (dx) and two for the wavelength residual (dy_nm). For each residual type, there is a plot with the sigma range and then a plot showing the older default limits of (-0.1, 0.1) for the spatial and (-0.03, 0.03) for the wavelength. I've also added a note for each of the 1D subplots that shows the number of data points (i.e. number of fibers and number of lines respectively) as well the number of outliers. The number of outliers is determined by ±2.5σ regardless of the limits shown on the plot. |
| Comment by Wilfred Gee [ 29/Feb/24 ] |
|
For the command line, the config options are useSigmaRange as a boolean or xrange, wrange for spatial and wavelength ranges respectively. Currently these only accept a single value which define the upper and lower range. --config plotResidual.useSigmaRange=False or --config plotResidual.xrange=0.9 --config plotResidual.wrange=0.05 |
| Comment by Wilfred Gee [ 02/Mar/24 ] |
|
Reviewed and merged. |