-
Type:
Task
-
Status: Done (View Workflow)
-
Priority:
Normal
-
Resolution: Done
-
Affects Version/s: None
-
Fix Version/s: None
-
Component/s: None
-
Labels:None
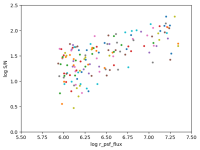
Some of FLUXSTD have low S/N for their PSF flux. Here is a plot for visit=92557.
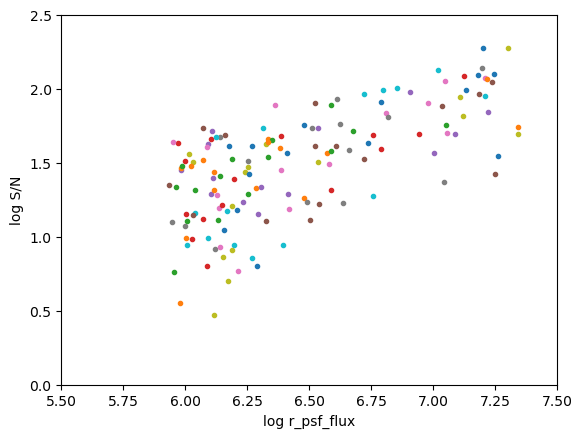
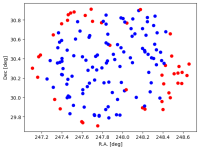
If I separate the upper/lower half of this broad correlation and plot the (RA,Dec) distribution of FLUXSTD, I got this figure. The red points are the lower half (i.e., FLUXSTDs with low S/N for their brightness). The cobra positioning accuracy was not great at the field edge and I am likely looking at that effect. But, I will look at the raster data to make sure if things are consistent.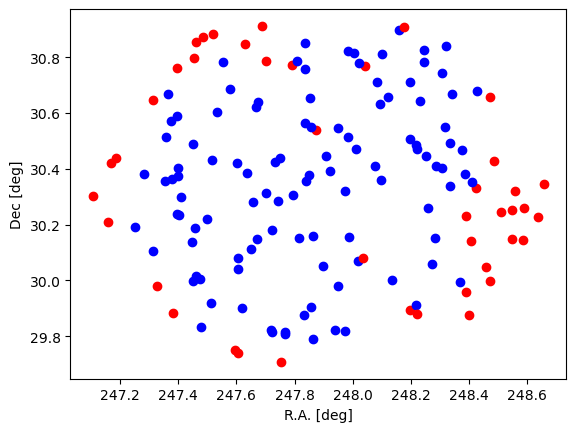
- relates to
-
PIPE2D-1251 flux calibration QA for EDR2
-
- Done
-
